So I need an idea of the size of House Battery to get. To Store the excess solar energy from our solar panels.
Well the CUMonitor plus the tel-tec web calculator lets you model the problem so you can try out different house battery capacities at the different times of the year. see example logging data here.
If you are interested in joining the CUMonitor user group fill out the form here. Note you will have to purchase a CUMonitor box to log your house it you want to take part as a member
The Battery size is entered at the top of the page and the first (light green) bar chart is of the Power remaining in the Battery and the second is the Power from the solar panels. The Assumption is made that the 24 hr period starts with the Battery full.
Some CU Meters have an LED that illuminates when the Meter is exporting the to Grid CUMonitor can optionally monitor this or use an internally calculated flow,
The MAX7219 component comes with a edge connector and a connecting cable
This edge connector needs to be soldered onto the Web Rd Module to connect the components
The ESP8266 01S Programmed for Niche-tec Web Connect is supplied preprogrammed with test software that displays a test pattern on the Dot Matrix display and is ready to connect to your LAN using one of the Free Web RD software packages available on the play store.
Assembling these three components will create the Consumer Web RD Display
Web RD or Web Remote Display is a stand alone display unit that has the ability to get data from the internet (LAN Required) and display it. This kit is a minimalist set of hardware to support this functionality. We have reduced the cost so you only need to buy the Kit you intend to use. We offer links to other providers that sell the components so you can source them at the lowest price. The Housing of the display is left to the user we have partnered with Xen Dragon 3d Printing to offer a 3d Printed housing:
We offer a free download from Cricut that creates a housing from cardboard that is free of any cost.
The Web RD PCB has been updated to reduce the cost of the Web RD by removing the CP2102 USB to serial adapter and replacing it with a onboard voltage regulator. It does mean that this version wont be able to monitor UART debug from the ESP8266.
These have put into testing service and we anticipate release in the new year
Development of the CUMonitor hardware is progressing and the first boards acceptable for consumer release have arrives and are going thru soak testing.
CUMonitor PCB changes
The major changes have been to add the facility to power the board through a micro USB connector adding onboard voltage regulation of the 3.3v. The new A to D circuits can run without the the addition of a burden resistor so these have been removed. This means that the CUMonitor consumer PCB assumes that the 30A 1V current clamps will be used. But this should be OK form most household use cases. The surface mount spaces for the burden resistor have been left in case 100A clamps are required. There was a missing resistor on the previous board that is also fixed.
The CU Monitor PCB upgrade has involved quite a few changes. Moving to the ESP32S2 processor has meant completely revamping the build to use the newer and faster processor. Aside from doing away with the with the ADS1115 chip and reading the A to D values across the I2C bus the board has simplified in a number of other ways.
I’m pleased with the upgrade process even though the PCB board will have to be recreated. The porting meant using new libraries and did away with the I2C bus. There is lot more space on the chip for expansion and the number of samples per second has risen to more than 9000 from the few hundreds we had with the old design. The current run of PCB’s have burden resistors that are now redundant and one missing resistor from channel 2. But otherwise appear to work great. I’m soak testing them now before ordering some production quality boards and to see if there are any “undocumented software features” in the new libraries.
One change to go in is adjusting the recess of the jack plug sockets these need to be less as when the jack plugs are inserted thru the case they experience an ejection force because the case pushes the jack plugs away from the PCB. Also I need to add pylon holes to allow rapid alignment when the PCB is inserted into the case
The CU monitor senses the current flow at the two points marked. It’s important to realise that even if the voltage generated by the Grid tie inverter has exactly the same peak voltage as the National Grid the current draw into the house may vary throughout the waveform because the loads in the house are not perfectly resistive and the current consumption of devices in the house will not be linear with voltage. Practically, this may result in current flowing into the house at some parts of the waveform and out at others. This means that the current at the the solar panels and the Grid tie inverter input feed will have an ambiguity, adding a safe margin ensures that current flow in or out throughout the whole of the waveform can be accounted for.
The current will be in phase with the voltage for a purely resistive load, will lead the voltage for a capacitive load and will trail for an inductive load. We need to measure the current at the sensors throughout a full cycle so this can be assessed and we can do this by sampling the current multiple times throughout the 50Hz cycle to calculate the aggregate current.
Reasonable number of samples
Each current data point sample has to be individually processed (read, scaled and logged). To give a reasonable approximation of the current flowing throughout the cycle, I insisted that a minimum of 10 samples are taken each cycle
This means the sample frequency needs to be at least 500hz per channel to sample a 50Hz cycle. Both the output from the Grid tie inverter and Grid feed need to be sampled. My first design used the ESP8266 ESP01S card which was able to achieve this but the I2C bus connecting the ADS1115 to it was having problems keeping up switching between the two channels and all the other processing.
The Grid connection in my perception is the most dynamic link, potentially switching direction more times than the other sample point. I decided to over sample this link while maintaining the 500hz minimum for the Grid Tie Inverter so I started using the ESP12
This was marginally more expensive than ESP01S but provided access to a 12bit on board ADC that allowed for this oversampling.
This combination worked well but meant only one channel of the 4 Channel ADS1115 was being used.
Having two components is more costly. The cost of ADS1115 plus the cost of the ESP8266 ESP12 is more expensive than the ESP32-S2-WROOM (which supports multiple ADCs). So I have redesigned the PCB to use this processor.
The power to the house is from the National Grid and our solar panels.
240V AC mains power
In the UK mains power is supplied from the National Grid. Alternating Current (AC) as voltage and current input is supplied as a nominal sinusoidal voltage of 240v RMS at 50 Hz with a peak to peak of about 338v. In reality this varies between 216 and 253 RMS. The voltage from the Grid goes from 0 volts to +338 volts down to -338 volts in 20 milliseconds. It repeats this 50 times a second (1000ms).
Resistive load
On the very simplest level a house is a resistive load. The voltage inside your house will follow a similar sinewave voltage at a slightly lower voltage because of the resistance in the wires of the Grid and inside your house.
Mains 240V AC ->
--> House Load AC
The voltage at the substation (on the Grid) will be more than that at the resistive load of the house and therefore the current will flow into the house from the Grid, through the electricity meter.
Grid tie inverter
Solar panels on the house generate electricity as Direct Current (DC). DC is fed in to a Grid tie inverter. The inverter inspects the sine wave voltage that is generated by the Grid as seen at the resistive load of the house and creates a matching sine wave voltage slightly above that of the house. This will cause current to flow from the Grid tie inverter through to the house and if there is enough power from the solar panels, out onto the Grid.
Grid <--
<-- Grid tie inverter
So the power consumption of the house will approximate to 240Volts RMS multiplied by the current into the house from the Grid plus that from the Grid tie inverter from the solar panels. Because the loads used in the house are not purely resistive this is not the whole store but it is a fairly good approximation.
Power management and current flow
To truly calculate the power usage, we would need to measure the voltage and the current profile throughout each cycle. In power management our aim is to manage the current supplied to the house so that we may use locally generated current rather than draw from the Grid. Power management rather than accurate power monitoring. Knowing the current flow is sufficient to achieve this if we also know the direction of flow. Both the Grid tie inverter and the National Grid will determine the voltage dynamically but use of the 240V RMS value will suffice to estimate power usage for our power management needs. Some electricity meters offer an LED that becomes solid lit when current is flowing out of the house and pulses when current is consumed by the house.
The latest PCBs for the CU monitor arrived this week. They were supposed to be the test batch to prove the release of the CU Monitors to the website. There followed a frustrating two days of soldering up and testing. Essentially I had the surface mount ADS1115 that needed to be soldered onto the board. These are tiny chips that can be tricky to solder. After soldering 3 boards I had one that worked intermittently and two that just plain failed to work. So I looked at the working one on the bus analyser and the timing of the I2C bus seemed to be causing a lot of NAKs. After tweaking the software driver, this became a lot more reliable, which suggested the bus layout on the PCB was bad! making the communication timing marginal.
This means this will not be the last board! This got me thinking. The ADS1115 is a fairly low cost 16 bit A to D converter, initially I chose this chip because it was a module that lends itself to rapid prototyping but it has 4 channels and is accessed across an I2C bus. This chip has caused me to redesign the CU Monitor PCB in the past because we are reading more than one channel rapidly it can cause significant slow down in the sample rate. Currently the CU monitor only uses one of the channels to boost the read speed. This makes this chip way over specified for our purpose.
So I intend to reassess the use of this chip and I will create a sequence of design/posts and explain my design decisions to document this procedure and help me get it straight in my mind
Web RD a simple development project aims to connect a display as cheaply as possible to the internet. This development is intended for anyone wishing to display information available online without actually requiring a separate device. The Web RD PCB is available in our store. This will allow you to build your own project without recourse to hardware design. The Web Rd development consists of :
CP2102 USB to TTL Serial Converter
WebRD PCB or Assembled WebRD Module
MAX7219 Dot matrix LED Display
USB Male to Female Extension lead
ESP8266 ESP01S
The CP2102 is a low cost stable and reliable way to connect a project to the power providing both 5V and 3.3v outputs. I’ve run them for thousands of hours with no problem. Powering a Project can can be an issue. This piece of test gear does the trick nicely.
The MAX7219 Dot matrix LED display is the low cost way to display large text.
The ESP8266 ESP01S is a very capable processor that provides plenty of processing power and a very cost-effective way of connecting to the internet.
We have available in our store 3d printed enclosures that provide housing for the display available in a mixture of colours
There are many use cases that make use of the Web Rd
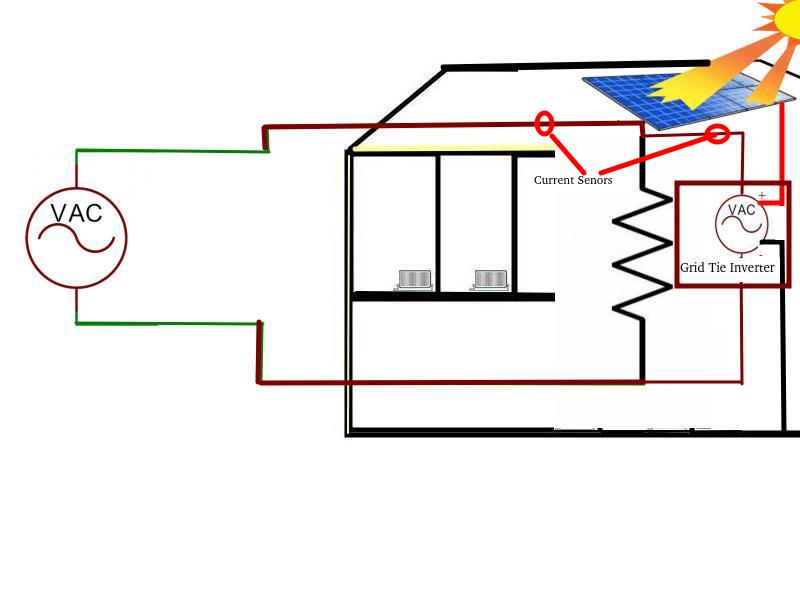
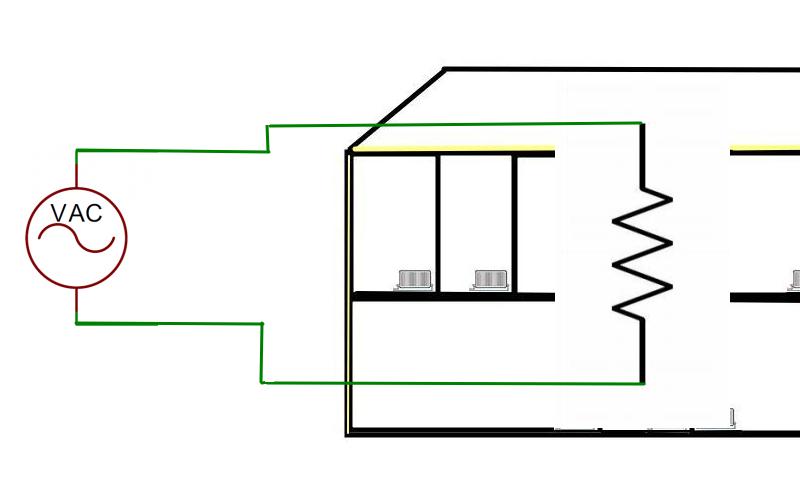
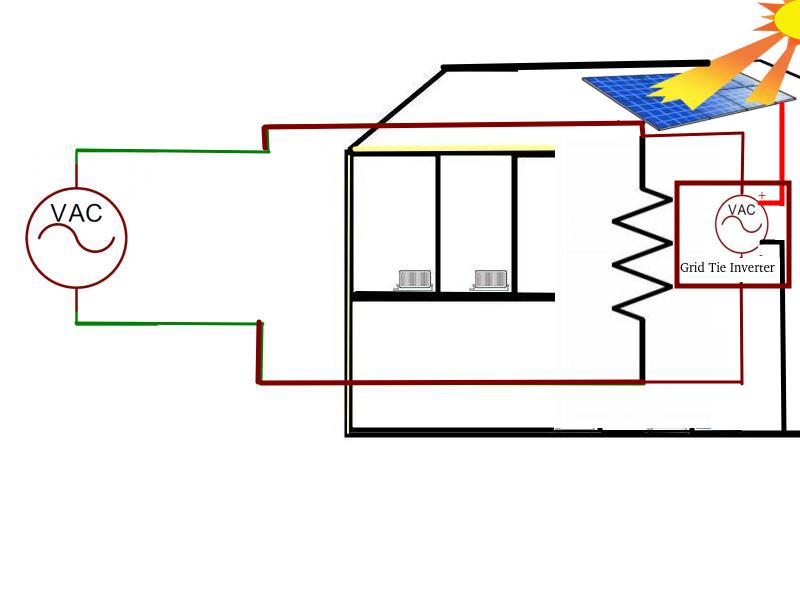
The CU monitor is a development designed to calculate the current flowing to the consumer unit from the grid and solar panels, broadcast is within the LAN and record the data to a website. I have taken a minimalist approach to keep the costs down. It uses two current clamps to measure the current
Current clamp sensor
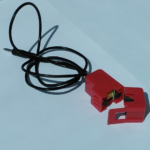
One is clipped around one of the single core cables to the consumer unit into the house from the grid and the other other is clipped around the one of the single core cables that come from the solar panels inverter.
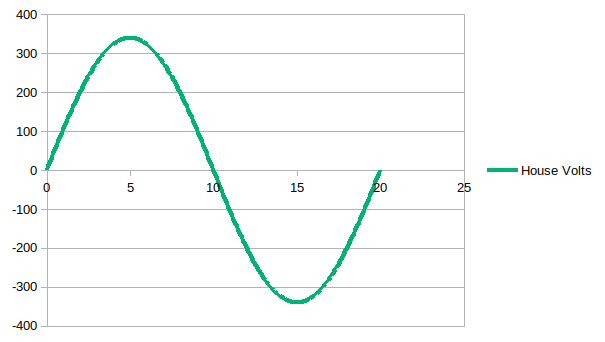
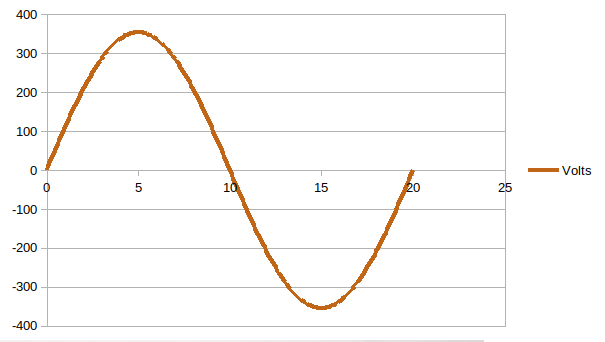
These connections provide the minimum number of connections. We have an algorithm that predicts whether the grid connection is importing or exporting to the grid from the profiles of the currents observed on these clamps.
The CU monitor also provides an optional photo resistor input that can be blue tacked to the front of your electricity meter as some electricity meters have an LED that becomes illuminated when power is being exported to the Grid. This can offer a confirmation that our algorithm is correct.
CU monitor Hardware
The CU monitor kit comprises our own PCB which hosts a processor that is used to calculate the AC current flow and records it to our display website. The PCB may be powered either by a USB lead or via a 240V mains power plug. The electronics are housed in an IP55 mini Junction box.
USB connection kit (no soldering required)
CP2102 USB to TTL Serial Converter
2 or 4 Female to Female Jumper wire
USB extension cable
USB Cable
USB power brick or available USB socket
Mains powered kit (minimal soldering):
Hi Link 3.3V 3W P/N HLK-PM03
Varistor
Power Block
Either power system will suffice. The USB connection requires no actual soldering and does not require the user to handle mains AC power. If you are comfortable wiring into the mains power then the other kit is available.
disclaimer: handling mains voltage can be very dangerous. Do not do so unless you are qualified and comfortable with the wiring and connecting of mains power.